Monitoring Django with Tracing and OpenTelemetry
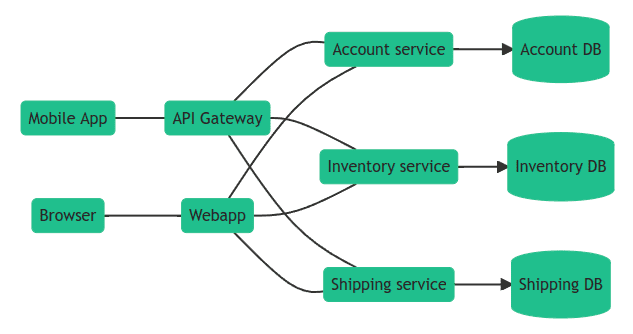
23 September 2022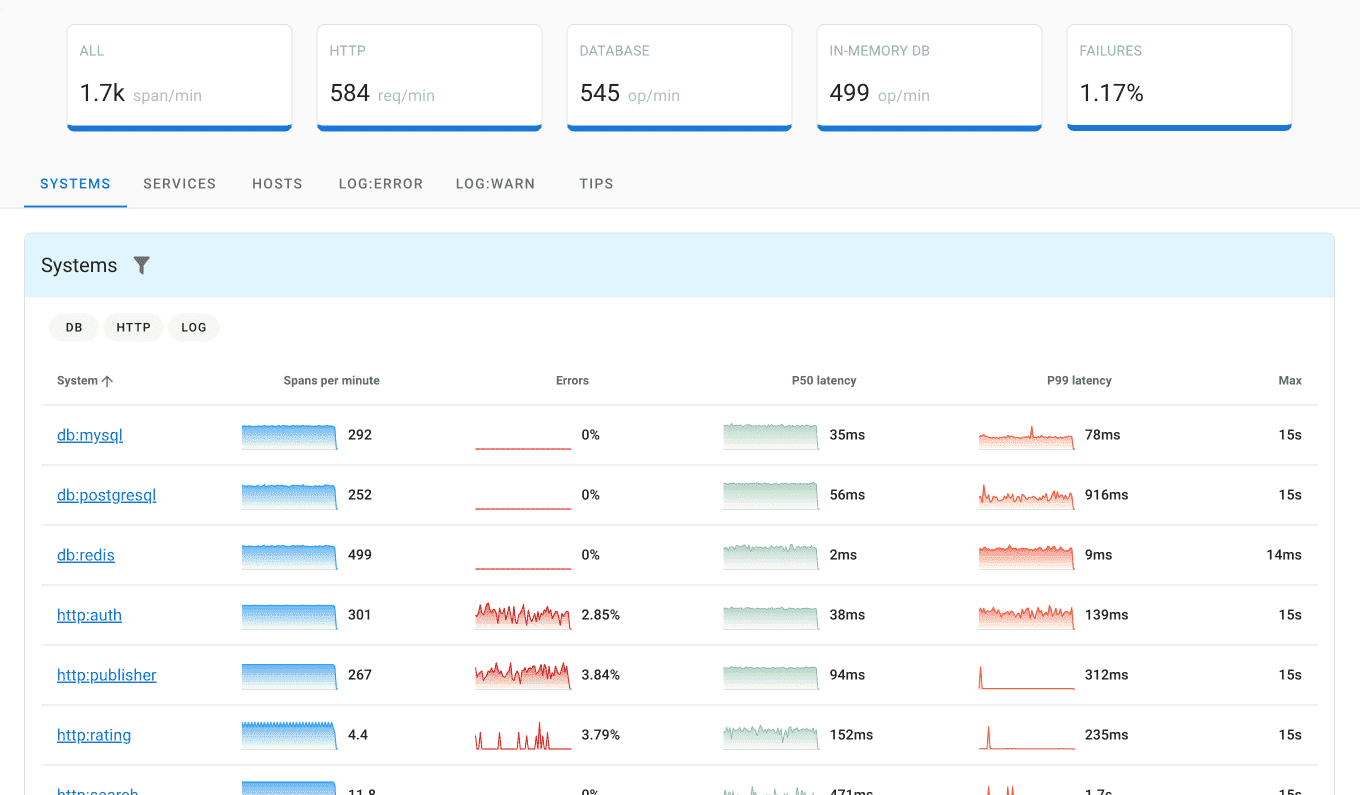 Distributed tracing allows to observe requests as they propagate through distributed systems, especially those built using a microservices architecture. In a distributed environment, tracing also helps you understand relationships and interactions between microservices. Distributed tracing gives an insight into how a particular microservice is performing and how that service affects other microservices.
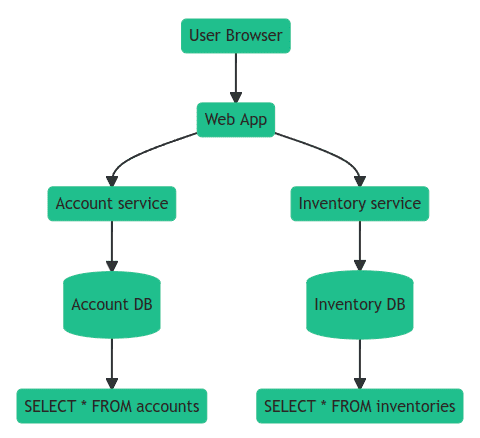
Using tracing, you can break down requests into spans. Span is an operation (unit of work) your app performs handling a request, for example, a database query or a network call.
Trace is a tree of spans that shows the path that a request makes through an app. Root span is the first span in a trace.
To learn more about tracing, see Distributed tracing using OpenTelemetry.
What is OpenTelemetry?
OpenTelemetry is a vendor-neutral standard that allows you to collect and export traces, logs, and metrics.
OpenTelemetry is available for most programming languages and allows to send performance data to any tracing tool of your choice.
OpenTelemetry is a community-driven open source project that offers several components:
-
OpenTelemetry API is a programming interface that you can use to instrument code and collect telemetry data.
-
OpenTelemetry SDK is the official implementation of OpenTelemetry API that processes and exports collected telemetry to backends.
-
OpenTelemetry Collector is a proxy between your application and a backend. It receives telemetry data, transforms it, and then exports data to backends that can store it permanently. Collector can also act as an agent that pulls telemetry data from monitored systems, for example, Redis or filesystem metrics.
-
OTLP is the OpenTelemetry protocol used by SDK and Collector to export data to backends or other collectors. As a transport, OTLP can use gRPC (OTLP/gRPC) or HTTP (OTLP/HTTP).
How to use OpenTelemetry?
OpenTelemetry is available for most programming languages and provides interoperability across different languages and environments.
You can get started with OpenTelemetry by following these 5 steps:
-
Step 1. Install a distributed tracing tool.
-
Step 2. Browse OpenTelemetry instrumentations to find examples for your framework and libraries.
-
Step 3. Configure OpenTelemetry SDK to export telemetry data to the tracing tool.
-
Step 4. Learn about OpenTelemetry Tracing API for your programming language to create custom instrumentations.
-
Step 5. Install OpenTelemetry Collector to gather infrastructure metrics.
OpenTelemetry Python API
You can create spans using OpenTelemetry Python API like this:
from opentelemetry import trace

tracer = trace.get_tracer("app_or_package_name", "1.0.0")

def insert_user(**kwargs):
    with tracer.start_as_current_span("insert-user") as span:
        return User.objects.create_user(**kwargs)
You can also record attributes and errors:
def insert_user(**kwargs):
    with tracer.start_as_current_span("insert-user") as span:
        if span.is_recording():
            span.set_attribute("enduser.id", kwargs["id"])
            span.set_attribute("enduser.email", kwargs["email"])
        return User.objects.create_user(**kwargs)
OpenTelemetry also has plans to add support for Python Metrics and Python Logs.
Django OpenTelemetry instrumentation
To instrument Django, you need a correspoding OpenTelemetry Django instrumentation:
pip install opentelemetry-instrumentation-djangoDjango instrumentation uses DJANGO_SETTINGS_MODULE env variable to find settings file. Django defines that variable in manage.py file so you should instrument Django app from that file:
# manage.py

from opentelemetry.instrumentation.django import DjangoInstrumentor

def main():
    # DjangoInstrumentor uses DJANGO_SETTINGS_MODULE to instrument the project.
    # Make sure the var is available before you call the DjangoInstrumentor.
    os.environ.setdefault("DJANGO_SETTINGS_MODULE", "mysite.settings")

    DjangoInstrumentor().instrument()
For more details, see OpenTelemetry Django guide.
What is Uptrace?
Uptrace is an open source DataDog competitor powered by OpenTelemetry and ClickHouse. It helps developers pinpoint failures and find performance bottlenecks.
Uptrace uses OpenTelemetry to collect observability data and ClickHouse database to store that data. By using an optimized ClickHouse Go scheme, Uptrace allows to significantly reduce storage requirements, improve query performance, and lower monthly SaaS bills.
Uptrace itself is a single Go binary that can process billions of spans and that can be easily installed with a single command using DEB/RPM packages. Uptrace binary and ClickHouse database is all you need to get started.
What’s next?
Next, you can continue exploring OpenTelemetry or start instrumenting your app using popular instrumentations:
- OpenTelemetry guide for Gin and GORM
- gRPC OpenTelemetry
- Golang ORM OpenTelemetry
- Go Redis OpenTelemetry
- Zap OpenTelemetry
If you need help solving your business problems with software read how to hire me.
comments powered by Disqus